
3 Statement Financial Model Review — Build Accurate Financial Projections in Excel
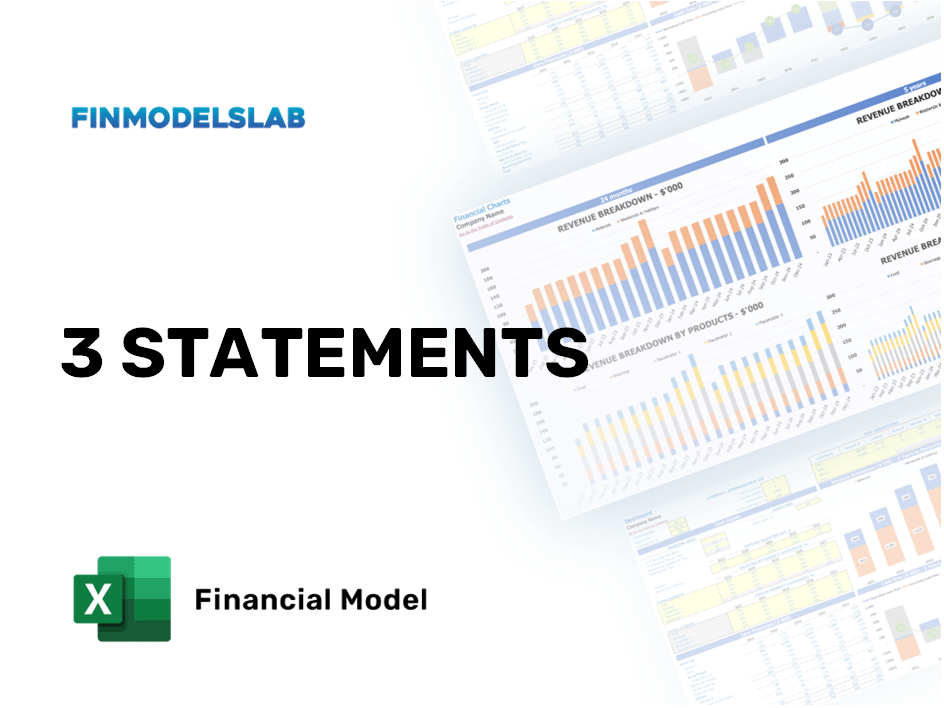
Quick takeaway: The 3 Statement Financial Model from Financial Models Lab is an Excel-based template that links income statement, balance sheet, and cash flow to produce investor-ready financial projections. It’s flexible, compact, and built for founders, analysts, and finance teams who need reliable forecasts without building a model from scratch.
Why this model matters (and who should read this)
If you need clean financial projections for a pitch deck, a board meeting, or monthly forecasting, spending days building a 3-statement forecast from scratch is costly. This product is aimed at early-stage founders, small finance teams, consultants, and freelance analysts who want a tested, linked Excel financial model that produces consistent Income Statement, Balance Sheet, and Cash Flow outputs.
What is the 3 Statement Financial Model?
The 3 Statement Financial Model is an open-access XLSX template that contains:
- An integrated Income Statement (P&L)
- A linked Balance Sheet
- A detailed Cash Flow Statement
- Assumptions, scenario and sensitivity analysis, and a dashboard with key metrics
Everything updates automatically when assumptions change, so the three core financial statements “talk to each other” — a critical requirement for credible financial forecasting and valuation work.
Product snapshot
| Price | $29 (compare at $49) |
| Format | XLSX (Excel) |
| Rating | 4.91 / 5 (Judge.me, 47 reviews) |
| Ideal for | Startups, SMEs, consultants, novice-to-intermediate financial modelers |
Key features and real-world benefits
1. Integrated Income Statement, Balance Sheet, and Cash Flow
Feature: The three statements are fully linked so that a change in revenue, expenses, or capital structure flows through all outputs.
Benefit: You eliminate manual reconciliation errors and save hours that would otherwise go into debugging formulas. For founders preparing investor decks, this produces consistent numbers across slides and appendices.
2. Assumptions-driven inputs
Feature: Centralized assumptions tab for revenue growth rates, COGS, OPEX, tax, working capital, and depreciation.
Benefit: Forecast scenarios become repeatable and auditable. Finance teams can show how a 10% change in growth or margin affects cash runway, breakeven, and valuation.
3. Scenario and sensitivity analysis
Feature: Built-in scenario tools and sensitivity tables that test upside, base, and downside cases.
Benefit: Quickly present risk-adjusted forecasts to investors and stakeholders. Use sensitivity outputs in negotiation or to plan contingency actions.
4. Dashboard and key metrics
Feature: A dashboard highlights revenue trends, cash runway, gross margin, EBITDA, and other KPIs.
Benefit: Non-financial stakeholders gain a clear snapshot without digging into spreadsheets — ideal for investor meetings and leadership check-ins.
5. Revenue, COGS, OPEX, CAPEX modules
Feature: Separate modules for revenue streams, cost of goods sold, operating expenses, capital expenditures and depreciation.
Benefit: The modular layout makes the model adaptable across industries (SaaS, retail, services, manufacturing). You can swap or extend revenue drivers without breaking links.
How teams actually use it — real-world examples
- Startup founder builds a 3-year forecast to accompany a seed pitch and demonstrates cash runway under three scenarios.
- Freelance financial analyst customizes the OPEX sheet to model headcount-driven costs for a SaaS client.
- Small CFO uses the dashboard to present monthly results and updated forecasts to the board, reducing time spent on slide prep.
“A clean, linked 3-statement model that saved us days of work. The dashboard is simple and effective for investor conversations.” — typical user feedback
Pros and cons — what to expect
Pros
- Fast to deploy — ready-made Excel template for immediate forecasting.
- Low cost compared with hiring a financial modeler.
- Clear structure and customization options for different industries.
- Well-rated by buyers (4.91 average).
Cons
- Requires basic Excel skills — formulas and structure may be intimidating for absolute beginners.
- Not a one-click plug-and-play for complex corporate finance tasks (M&A, advanced tax modeling).
- No shipping (digital product) — you’ll need Excel 2016+ or compatible software.
Who should buy the 3 Statement Financial Model?
Buy if you are:
- An early-stage founder preparing pitch materials or runway scenarios.
- A small finance team that needs a reliable forecasting framework without building it from scratch.
- A consultant or analyst who wants a repeatable Excel template to customize for multiple clients.
Skip it if you are:
- A complete Excel novice unwilling to learn basic formulas — you may need support to customize the model.
- Running highly complex corporate finance models (structured finance, multi-entity consolidations) — this template is best for single-entity forecasting.
Final verdict
The 3 Statement Financial Model from Financial Models Lab is an efficient, well-structured Excel template that lives up to its promise: accurate, linked financial statements and a usable dashboard for decision-making. At $29, it delivers excellent value for founders, small finance teams, and freelance analysts who need dependable financial projections quickly.
If your goal is to produce investor-ready forecasts, test scenarios, and communicate financial performance clearly — without hiring external analysts — this model is a smart buy. If your needs are extremely specialized or you lack any Excel experience, factor in a small learning curve or consider hiring support for customization.
Recommendation: Purchase the 3 Statement Financial Model if you want a low-cost, professional starting point for forecasting and reporting. It will save time, reduce formula errors, and strengthen financial storytelling for investors and stakeholders.
Get code here 14% OFF: Financial Models Lab

